 Product view
Network intelligence
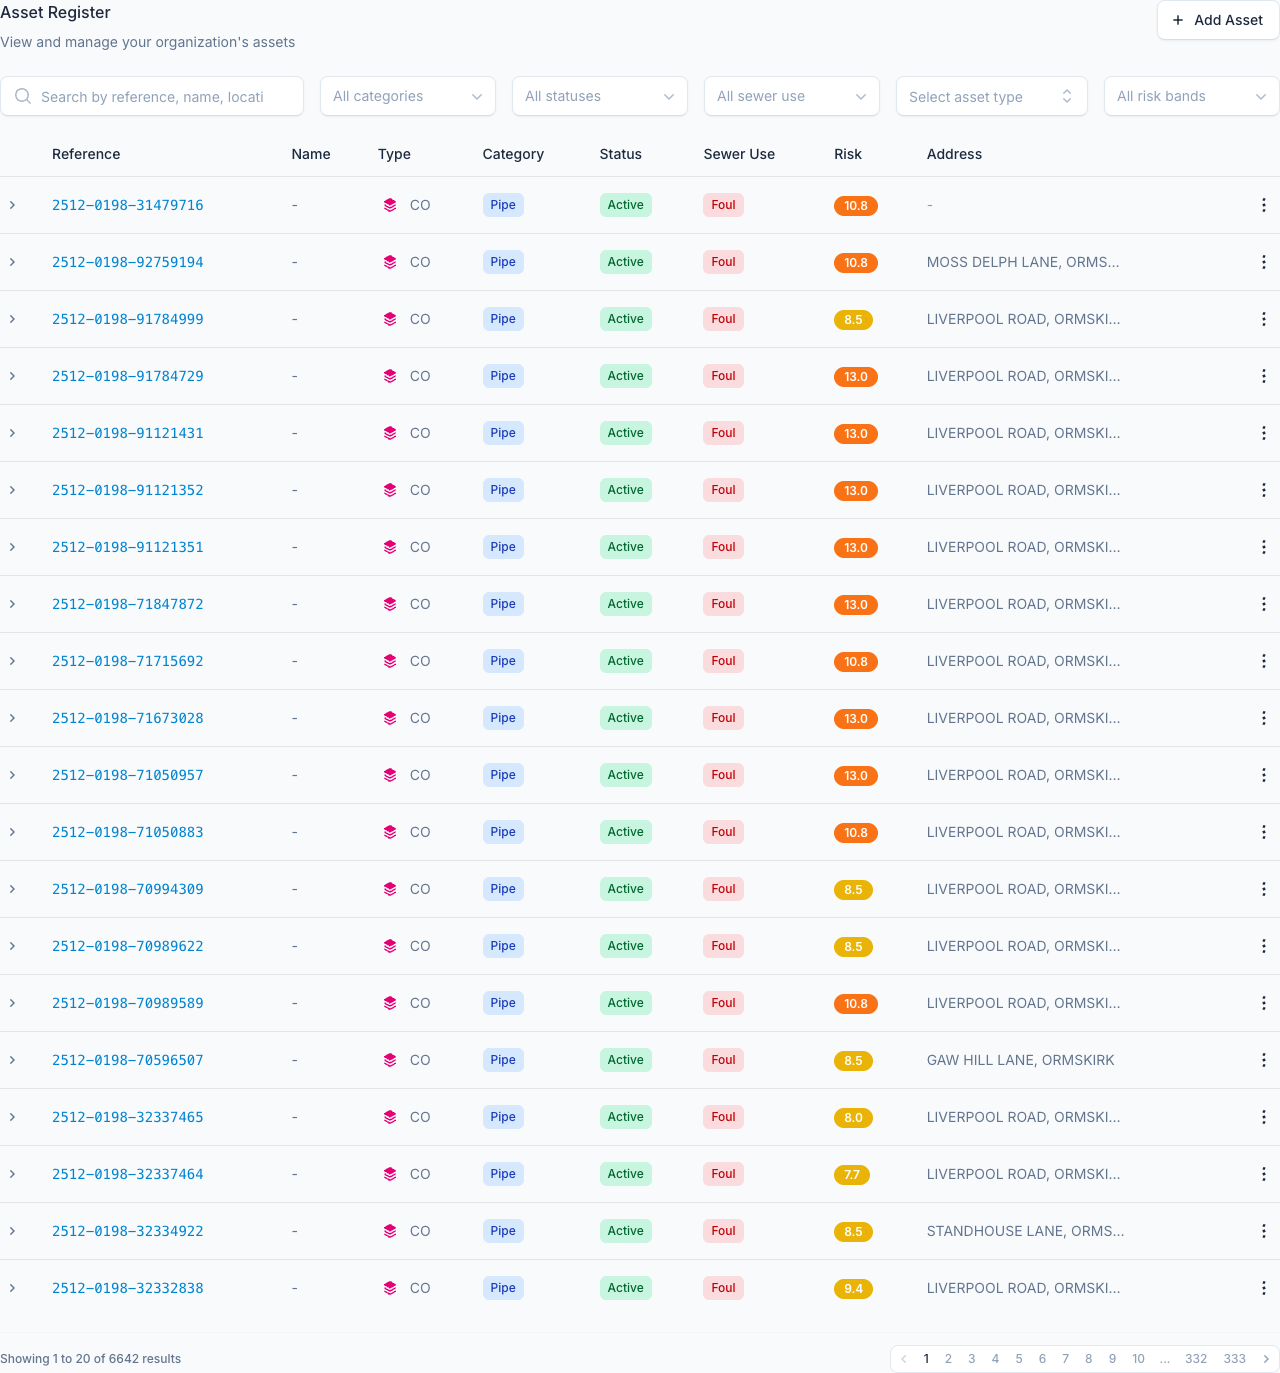
A single, trusted view of asset extent, condition, performance and risk.
See how it worksFrom CCTV survey to costed rehabilitation programme - one connected evidence base for your network.
No sales pressure · No preparation required · Bring your own questions
One connected evidence chain
SewerOne connects the operational steps that are usually split across spreadsheets, specialist tools and disconnected reports.
Capture CCTV and maintenance evidence
Apply consistent condition grading
Rank interventions by risk
Build auditable programme scenarios
Turn decisions into tracked work
Product view
A single, trusted view of asset extent, condition, performance and risk.
See how it works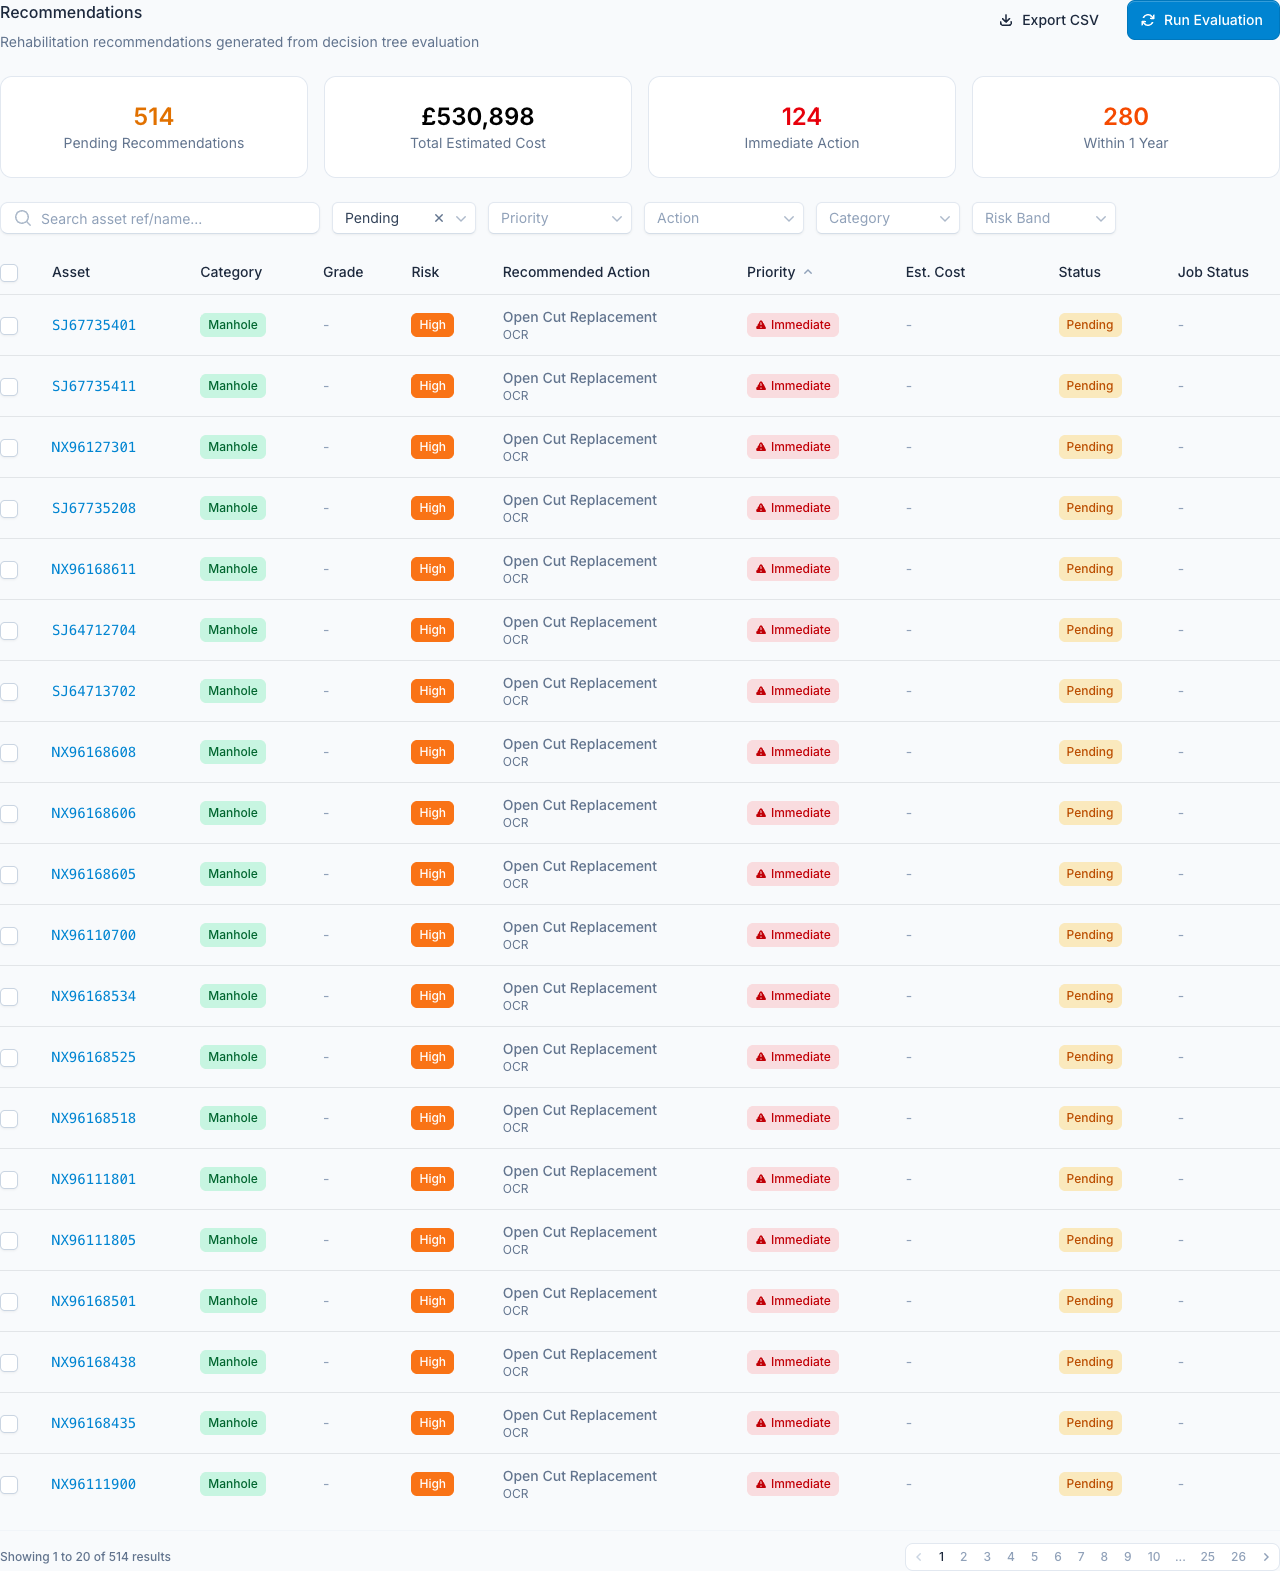 Product view
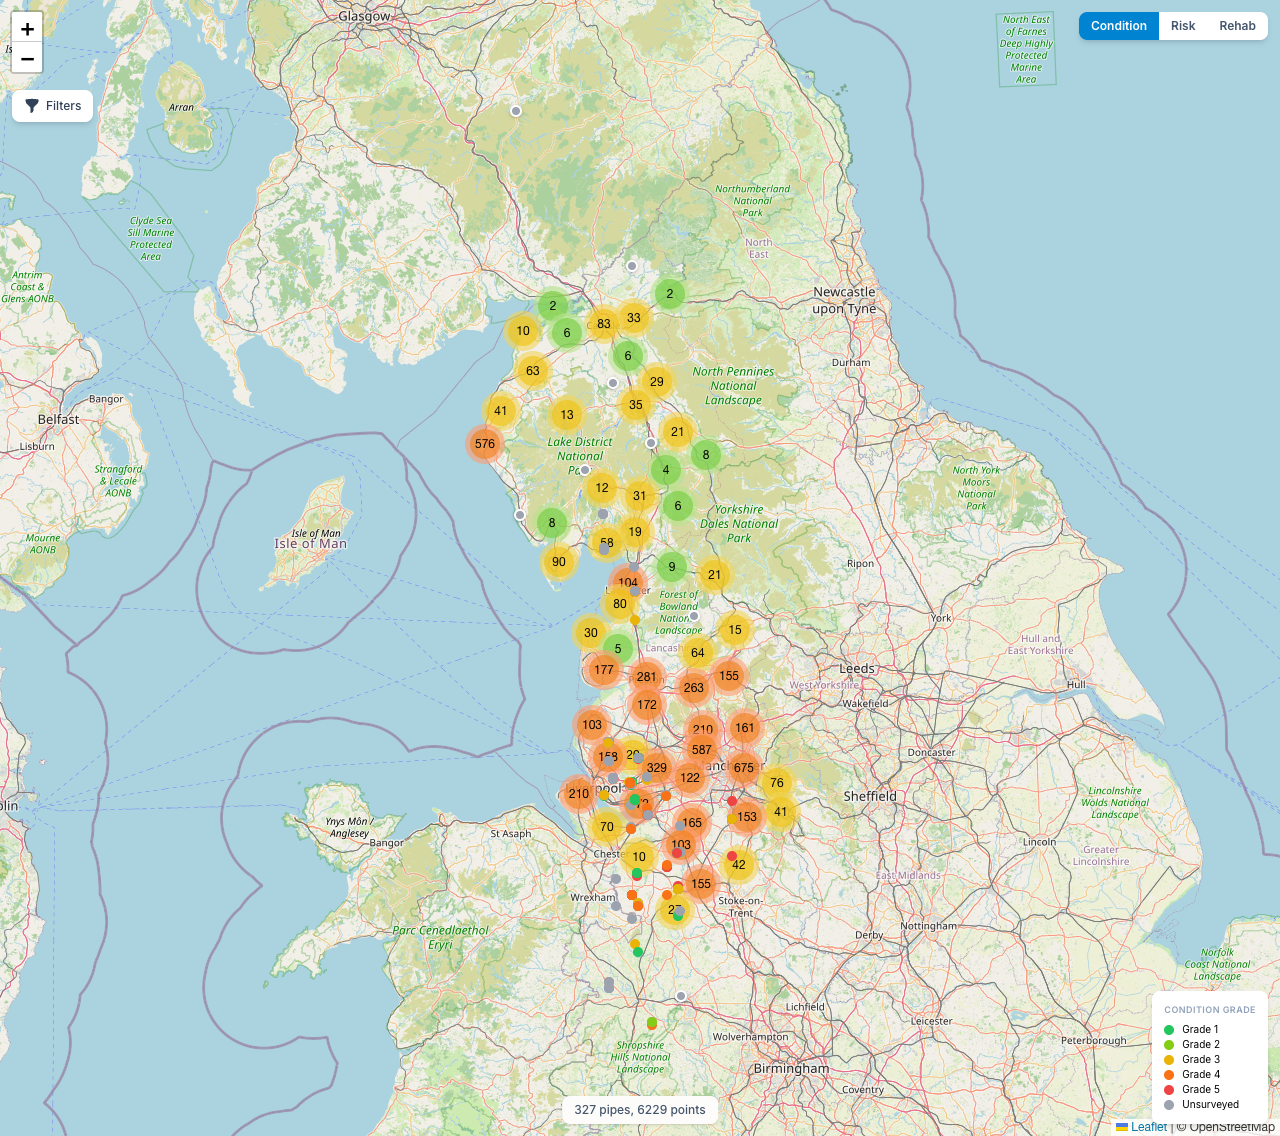
Direct spend towards the interventions that reduce risk and improve service outcomes.
See how it works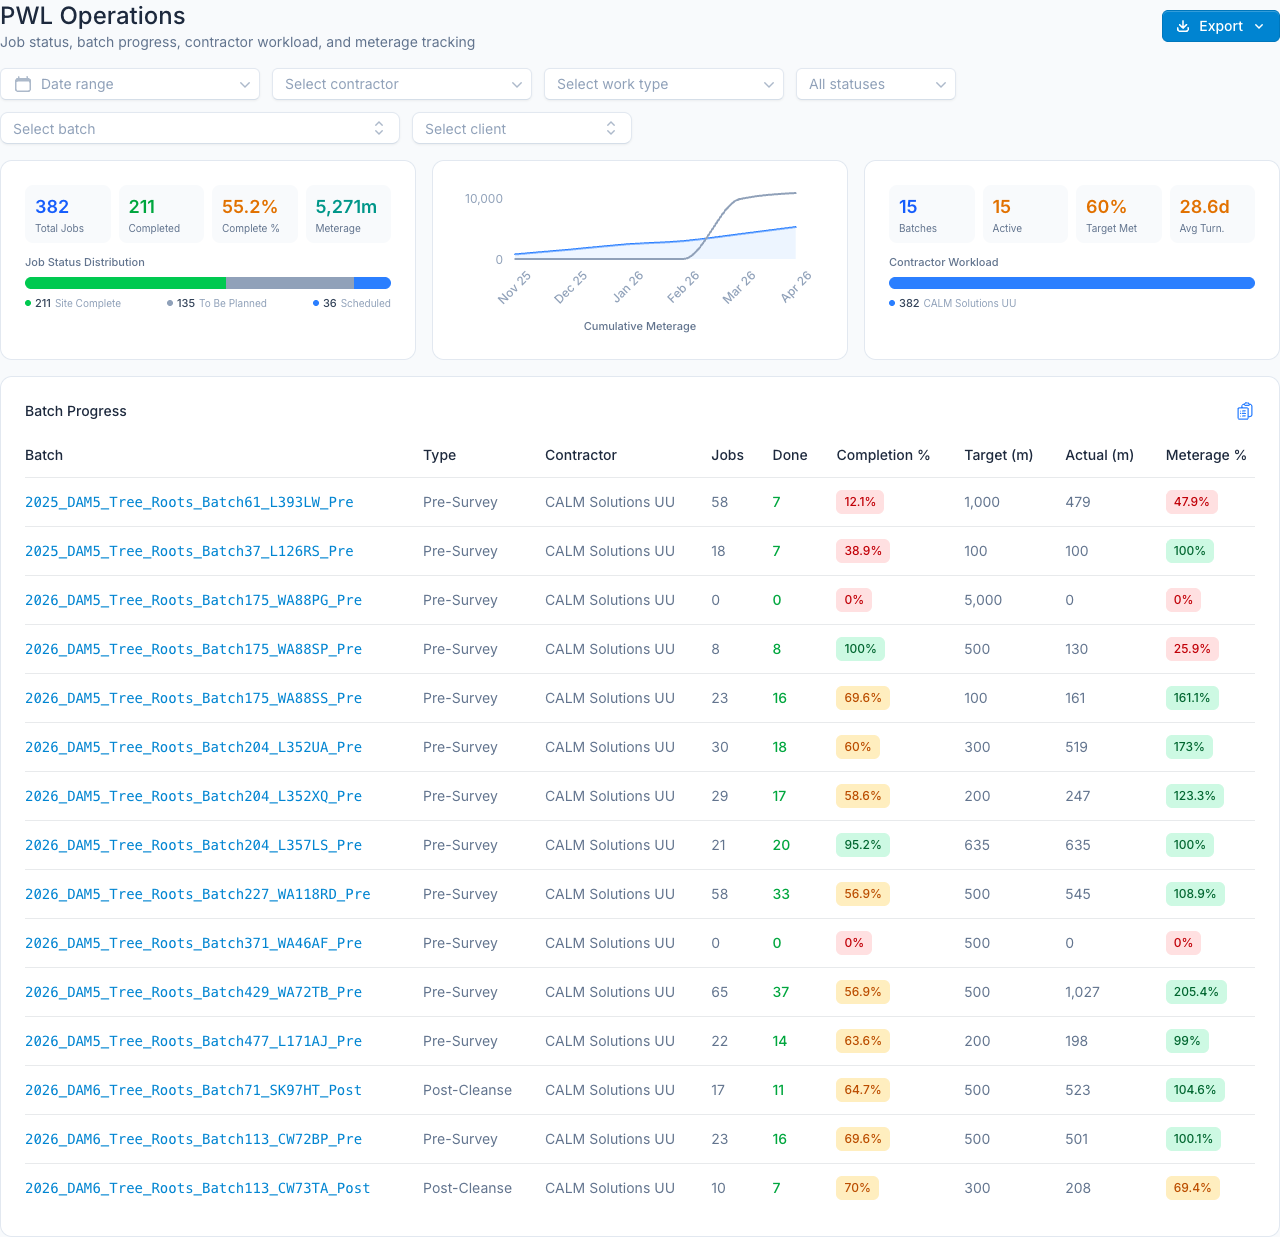 Product view
Plan, assign and monitor delivery with clear evidence and accountability.
See how it worksPlatform tour
Explore the five views that carry your data from asset record to board-ready decision.
Bring every asset, location and attribute into one spatially enabled source of truth.
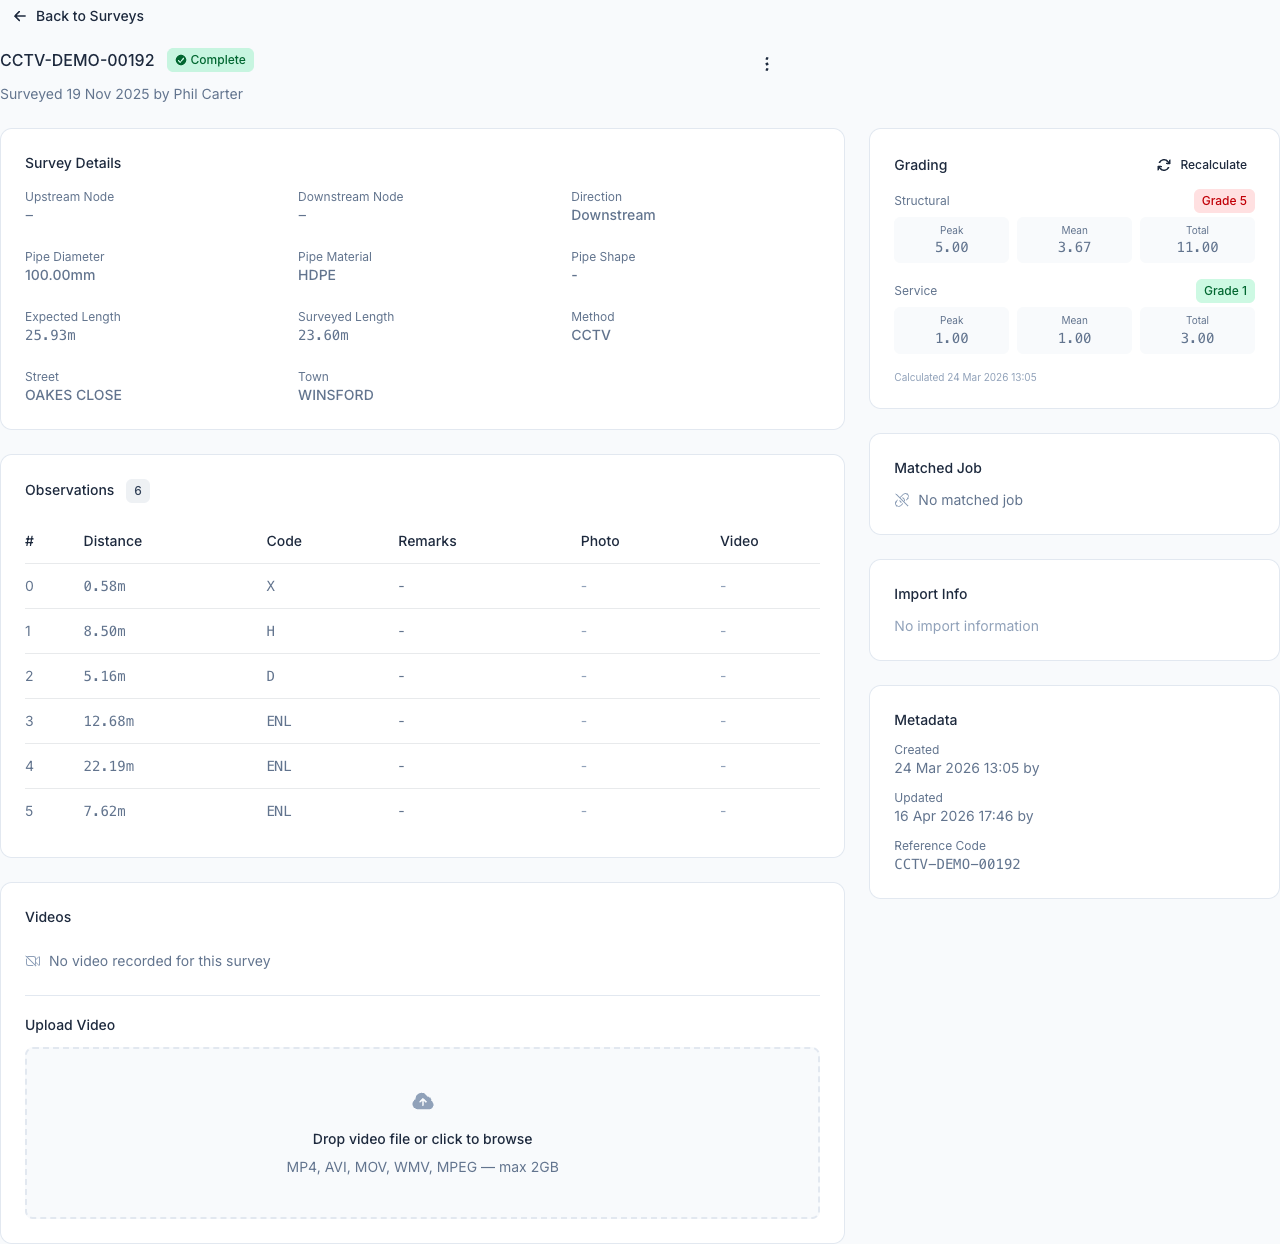
Import CCTV evidence, observations, grades and video without rebuilding the record by hand.
Combine likelihood and consequence factors into explainable priorities your teams can defend.
Turn risk and condition into prioritised, costed recommendations and executable work programmes.
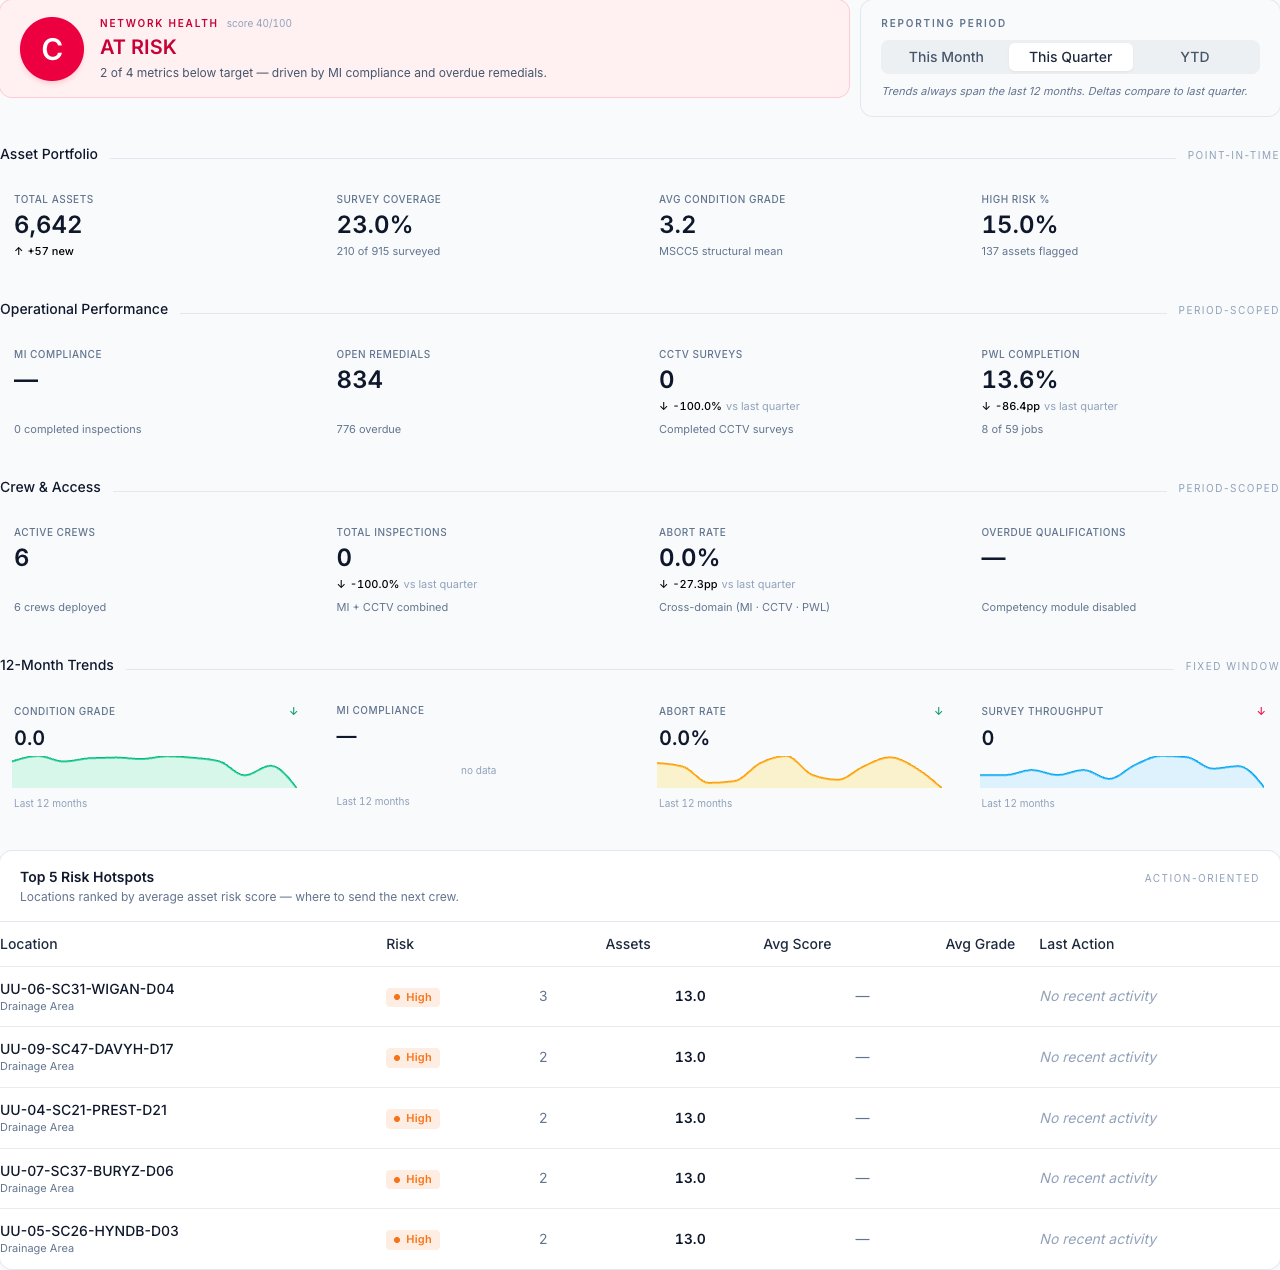
Use live KPIs, trends and drill-downs for operational reviews, investment cases and regulatory reporting.
Detailed platform guide
Open a module to review its workflow, capabilities and business value without navigating a 16,000-pixel brochure.
SewerOne's asset register is the foundation of everything. Every pipe, manhole, pumping station, and customer connection is recorded with its location, dimensions, material, condition status, and custom attributes specific to your organisation. Assets are organised into a configurable geographical hierarchy - regions, districts, drainage areas - however your business is structured.
Flexible asset categories - Define the categories your organisation works with - pipes, manholes, ancillary equipment, connections, or any combination - each with distinct attributes and behaviours
Unlimited configurable asset types - Create the exact asset types your network needs, each with custom fields tailored to what you want to track
Location hierarchy - Organise assets by region, district, zone, sector, catchment, or drainage area - you choose which levels matter
Full coordinate tracking - OS National Grid and WGS84 coordinates for start and end points of every asset
Asset lifecycle states - Active, inactive, decommissioned, pending adoption - track the full journey of every asset
Ownership classification - Public, private, adopted, Section 104, Section 106 - essential for regulatory reporting
Parent-child relationships - Group service pipes under connections, chambers under manholes - maintain your network's logical structure
Export & filtering - Advanced filters across every field, with CSV export for external analysis and stakeholder reporting
Stop managing your network in spreadsheets. SewerOne gives you a single source of truth for every asset - accessible to every team member with the right permissions, always up to date, and ready for regulatory reporting.
Already have asset data in another system or spreadsheets? SewerOne handles bulk data import through intuitive step-by-step wizards. Upload your CSV files, map columns (the system auto-detects common header formats), validate everything before committing, and import thousands of records in minutes.
Upload your CSV file and select encoding
Auto-mapping with manual override for every field
Dry-run finds every error before any data is created
Records created safely - small imports instant, large imports queued
Asset register import - All core asset fields plus unlimited custom attributes per asset type
PWL job import - Bulk import Project Work List jobs with automatic asset matching
CCTV survey import - Industry-standard XML files with observations, grades, and video files
Asset type & attribute import - Configure your entire asset schema via CSV
Location hierarchy import - Build your entire regional structure from a spreadsheet
Migration support - Tools and scripts available to extract data from your existing systems into SewerOne-ready format
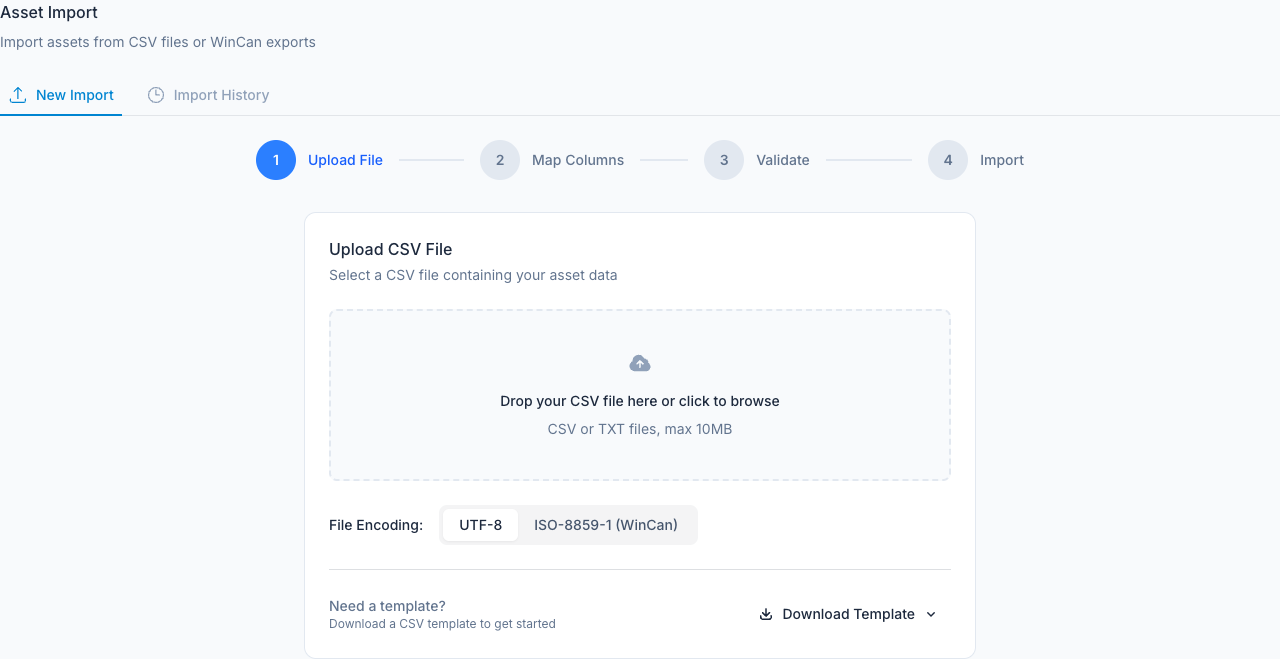
No data left behind. Whether you're migrating from an existing system or consolidating spreadsheets, SewerOne's import wizards validate every row before committing - so you can be confident your data is complete and accurate from day one.
CCTV surveys are the eyes of your sewer network. SewerOne imports survey data directly from industry-standard XML files - complete with defect observations, MSCC5 condition grades, and linked video footage. Every survey is automatically matched to the planned job it fulfils, closing the loop between what was planned and what was found.
Industry-standard XML import - Direct import from CCTV survey equipment software, handling hundreds of surveys per batch
MSCC5 defect coding - Full observation code library with structural and service defect categories, severities, and descriptions
Automatic condition grading - Structural and service grades calculated on a 1-5 scale from survey observations
Video file management - Automatic detection from server directories, transcoding to MP4, and playback from any browser
Automatic job matching - Surveys linked to planned jobs by node references, job numbers, or pipeline length
Batch & contractor tracking - Every import tied to a batch and contractor for accountability and quality tracking
Your contractors deliver survey data - SewerOne turns it into condition intelligence. No manual data entry, no spreadsheets, no disconnected video files. Import, grade, and analyse in one seamless workflow. When a survey is imported, risk scores and rehabilitation recommendations update automatically.
Not every asset gets a CCTV camera. Manholes, CSO chambers, outfalls, and other surface-accessible assets need regular physical inspections. SewerOne provides a fully configurable checklist system with automated grading across the dimensions you define - such as Health & Safety, Condition, and Serviceability.
Configurable checklists - Define inspection items per asset type, each with scored response options
Configurable grading categories - Define your own grade dimensions (e.g., Health & Safety, Condition, Serviceability), each calculated automatically using peak, mean, or total scoring
Remedial work tracking - Issues flagged during inspection automatically create tracked remedial actions with priority, scheduling, and completion monitoring
Inspection scheduling - Set frequency per asset or asset type; next-due dates update automatically when inspections complete
Permit management - Capture NRSWA street works permit details including grid references, traffic management, and reinstatement type
Photo attachments - Attach photos and documents to any inspection for visual evidence and record-keeping
Never miss an overdue inspection again. SewerOne tracks what's been inspected, what's due, what's overdue, and what needs remedial attention. Your compliance team gets real-time visibility, and your operations team knows exactly what to prioritise next.
SewerOne calculates risk for every asset in your network using models that you define and control. The system evaluates both the Likelihood of Failure (how likely is this asset to fail?) and the Consequence of Failure (how serious would it be?), combining them into a combined risk score displayed on an interactive risk matrix with drill-down capability.
Configurable risk factors - Choose the factors that matter to your organisation (e.g., condition grade, asset age, material, diameter, sewer use) - each with adjustable weights that must total 100%
Automatic recalculation - Risk scores update instantly when new survey data arrives, inspections complete, or asset attributes change
Configurable risk bands - Define your own risk bands, thresholds, and colours - the platform applies them consistently across every page and report
Factor breakdown - Drill into any asset's risk score to see exactly which factors contributed and how
Missing data handling - When a factor has no data (e.g., no age recorded), remaining factors are automatically re-weighted - no false scores
Batch recalculation - Recalculate all assets in one click when you adjust your risk model configuration
Stop guessing where to invest. SewerOne's risk model gives you an evidence-based view of your entire network, so capital planning is driven by data, not assumptions. Adjust the model to match your organisation's risk appetite, and watch the matrix update in real time.
SewerOne connects the entire pipeline from inspection to work order. Configurable decision trees evaluate each asset's condition grade and risk score to recommend the right rehabilitation action - patch repair, structural lining, full replacement - with estimated costs. Accept recommendations and generate Project Work List jobs in one click.
CCTV survey or maintenance inspection
Condition grade auto-calculated
LoF × CoF = risk score
Decision tree suggests action & cost
Generate work orders
Configurable decision trees - Define rules using condition grade, risk band, material, diameter, defect type, asset age, and category
Costed rehabilitation actions - Define your own actions (e.g., patch repair, lining, replacement, monitoring), each with per-metre and per-unit costs for accurate budgeting
Priority classification - Configurable priority levels (e.g., Immediate, Within 1 Year, Monitor) - clear language your teams already understand
Recommendation lifecycle - Accept, defer (with review date), reject, or supersede - full audit trail of every investment decision
One-click work order generation - Select accepted recommendations, create a PWL batch, and assign to a contractor in one flow
Cost summary dashboard - Total pending cost, immediate actions count, and within-1-year count visible at a glance
Investment decisions backed by evidence, not opinion. SewerOne's decision trees make rehabilitation recommendations transparent, consistent, and auditable - so you can defend every pound spent to regulators, board members, and stakeholders. Change the rules, and every recommendation updates instantly.
The Project Work List (PWL) module manages the full lifecycle of sewer inspection and maintenance jobs. Jobs are grouped into batches, assigned to contractors, tracked through execution, and closed out with actual meterage and completion records. Every CCTV survey that comes back automatically updates the corresponding job.
Batch management - Group jobs by programme, contractor, quarter, and year for structured work delivery
Job lifecycle tracking - To Be Planned → Scheduled → Site Complete → Closed, with access issue handling
Contractor assignment - Assign batches to contractors and track delivery metrics, completion rates, and quality
Client association - Link batches to the commissioning client for accurate billing and reporting
Meterage tracking - Expected vs. actual meterage per job and per batch, essential for contract management
Bulk import - Import thousands of jobs from CSV with automatic asset matching and status assignment
Survey auto-linking - When CCTV surveys are imported, they automatically match to jobs by node reference or job number
Activity timeline - Full history of status changes, notes, and events per job for accountability
Know exactly where every job stands. SewerOne connects Project Work List jobs to survey results, so when a contractor delivers footage, the job updates automatically. No manual status chasing, no spreadsheet reconciliation - just clean, connected operational data.
Sewer work is delivered by people - and regulators increasingly ask who was on site and whether they were qualified. SewerOne tracks your field workforce end-to-end: individual operatives, crew composition, and the industry qualifications that matter (EUSR Blue Card, SHEA, MSCC5, NRSWA Street Works, Confined Space, CSCS). Every MI inspection, CCTV survey, and PWL job links back to the crew that carried it out.
Operative register - Full records per field worker with role (supervisor, operator, operative, trainee), status, contact details, and employee reference
Crew composition - Build named crews (Survey Team North, Maintenance Crew South, Emergency Response, etc.) with a leader and assigned members, tracked with history
Crew assignment across work types - Attach a crew to any Maintenance Inspection, CCTV survey, or PWL job - then slice your reports by crew
Qualification tracking (opt-in competency module) - Record EUSR National Water Hygiene, SHEA, NRSWA Street Works, MSCC5 CCTV Inspection, Confined Space Entry, and CSCS certifications per operative, with card number, issue date, and expiry
Expiry awareness - Qualifications flagged as valid, expiring soon, or expired - see at a glance which operatives are about to fall out of compliance
UK water industry standards - Default qualification library mirrors the competencies UK water utilities actually require; tenant-customisable if your scheme differs
Prove compliance to regulators, clients, and internal stakeholders. SewerOne turns "who was on site and were they qualified?" from a paperwork scramble into a one-click answer - with a full audit trail behind it.
Business Intelligence
Every report features KPI cards, interactive charts, distribution breakdowns, and data tables with advanced filtering. Export any report to CSV for further analysis. All reports are scoped to your organisation's data with client-level filtering.
Scroll to explore →
Live view
The one page you take into the boardroom. Network Health RAG badge, 12 live KPIs across asset portfolio, operational performance, and crew & access - each with a period-over-period delta. 12-month sparkline trends and a Top 5 Risk Hotspots panel tell directors exactly where to act next.
 Live view
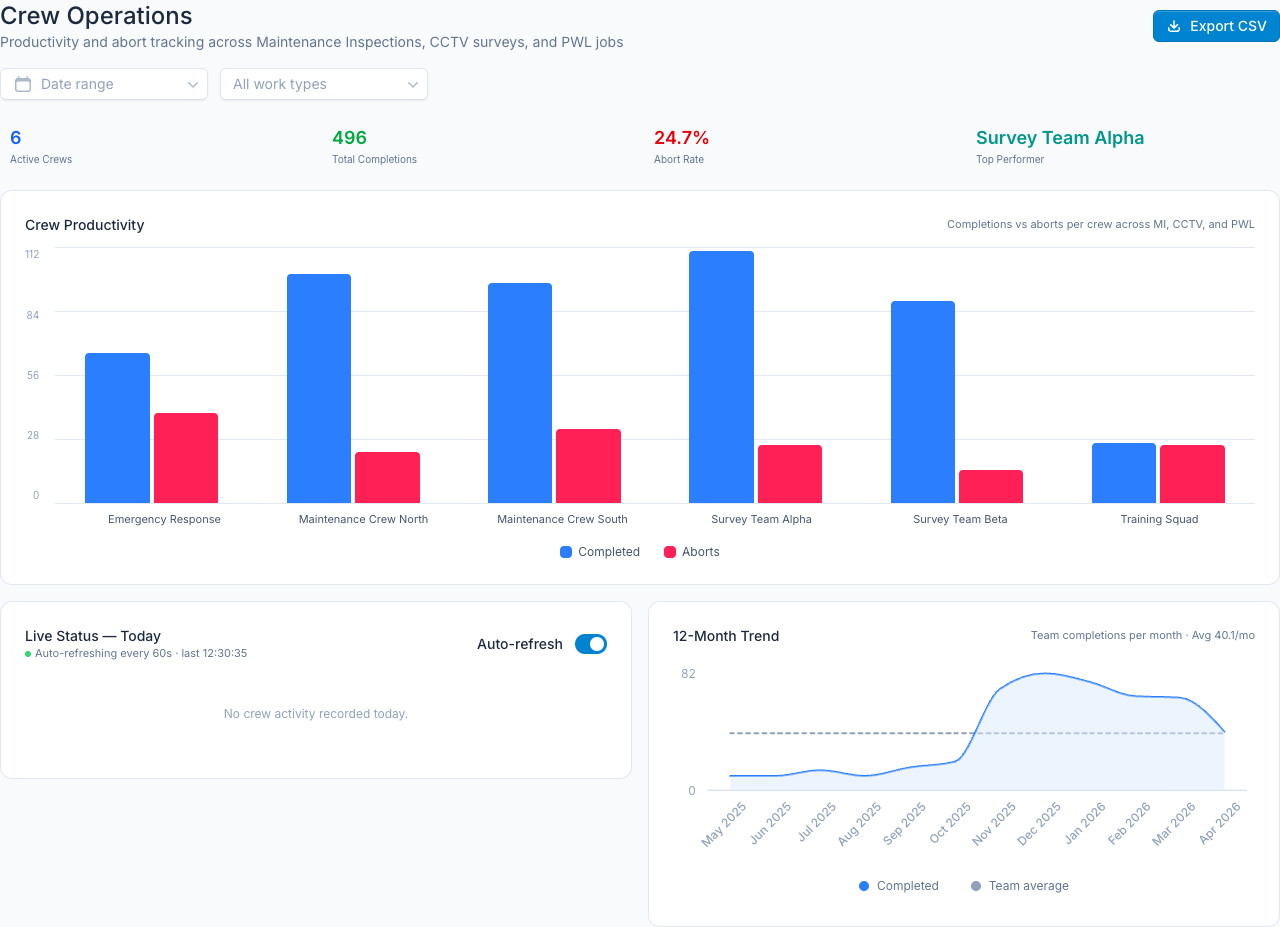
Field workforce performance in one tab. Per-crew productivity (MI + CCTV + PWL combined), cross-domain abort rate, today's live status with optional auto-refresh, and a 12-month completion trend versus team average - so team leads know who's ahead and where to rebalance.
 Live view
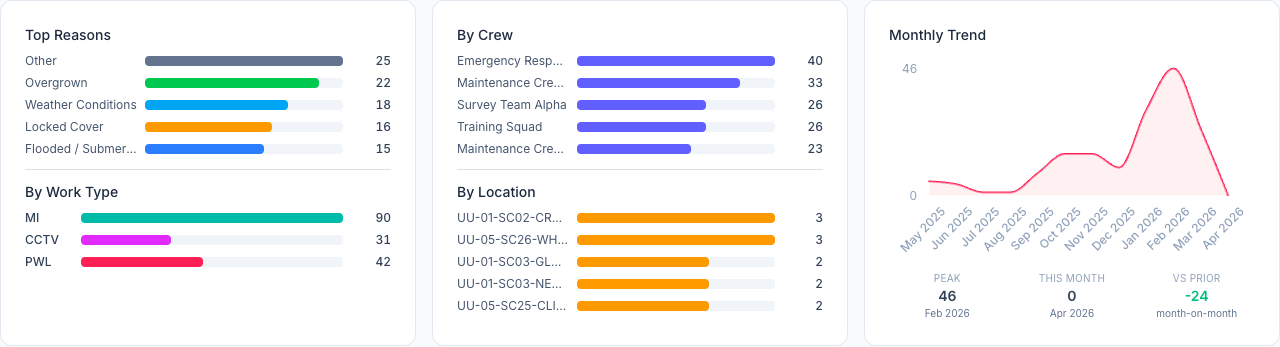
Why your crews can't complete work - and what to do about it. A single cross-domain view of aborted MI inspections, CCTV surveys, and PWL jobs, grouped by reason, location, work type, and crew. Resolution tracking with average days-to-resolve turns lost site visits into actionable intelligence.
Live view
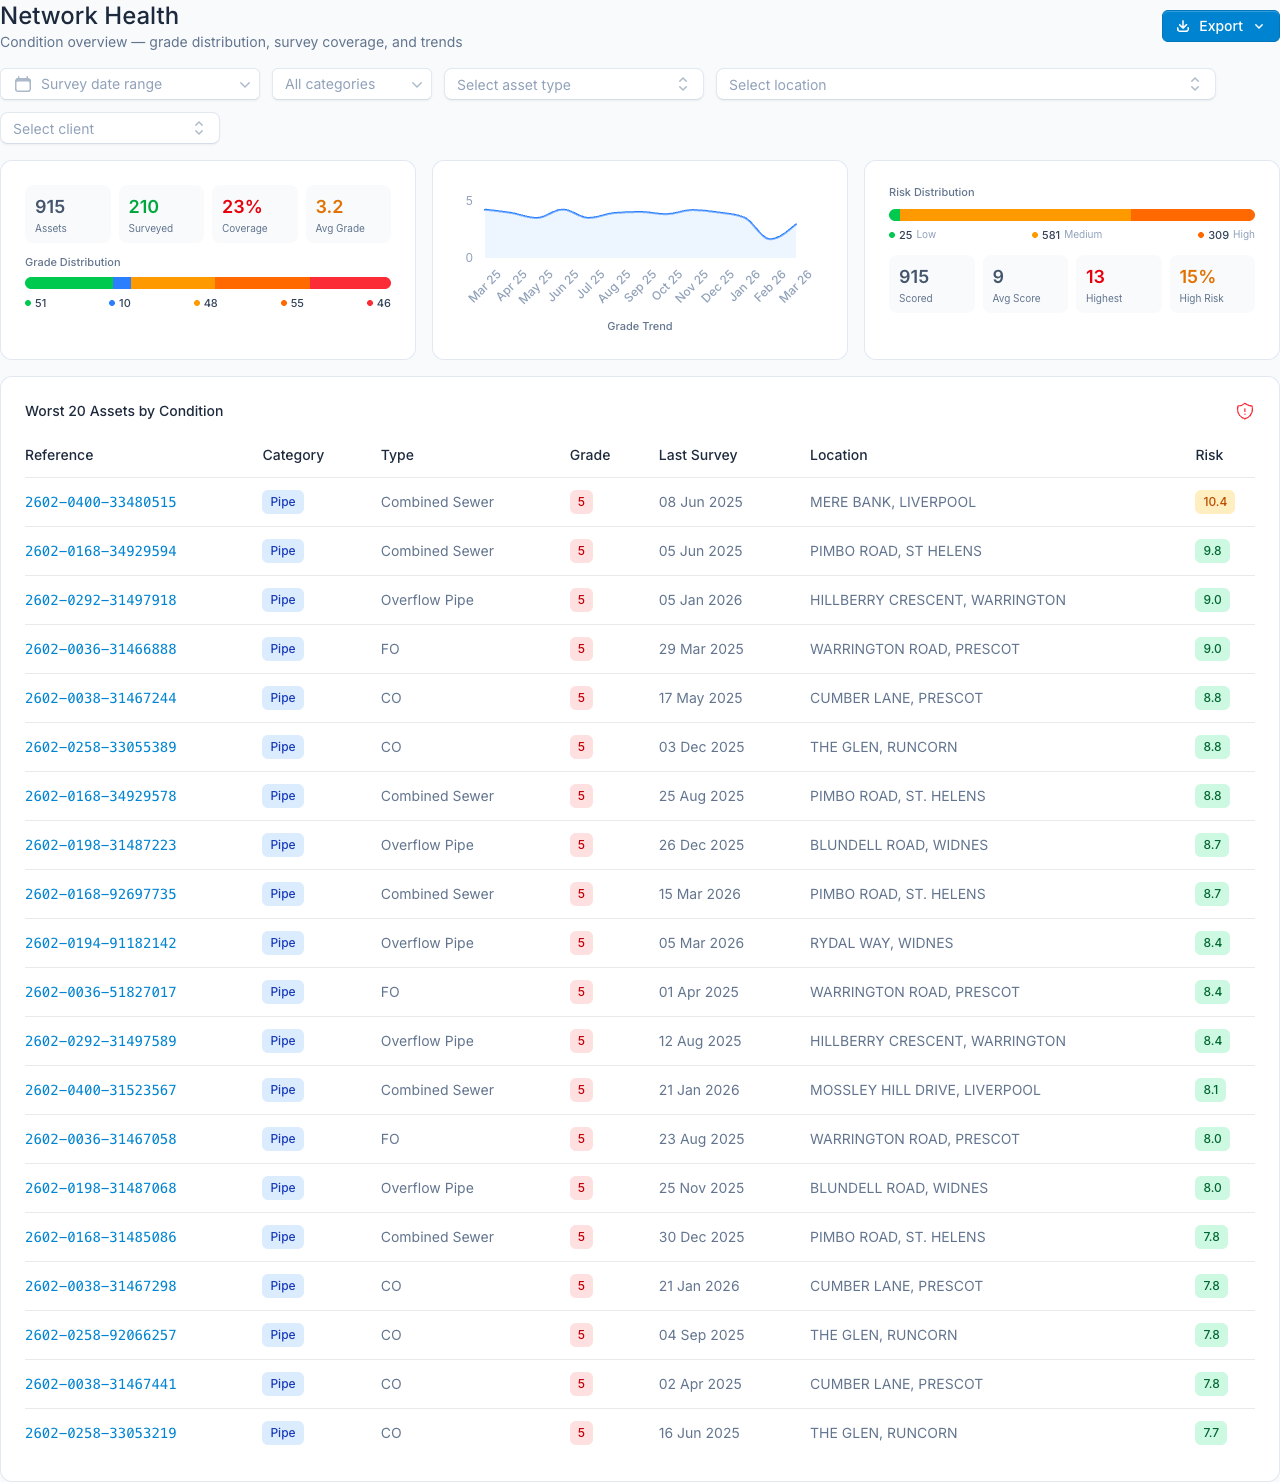
The big picture of your sewer network's condition. See survey coverage, average structural grade, risk distribution, and the worst-scoring assets in your network - all in one view.
 Live view
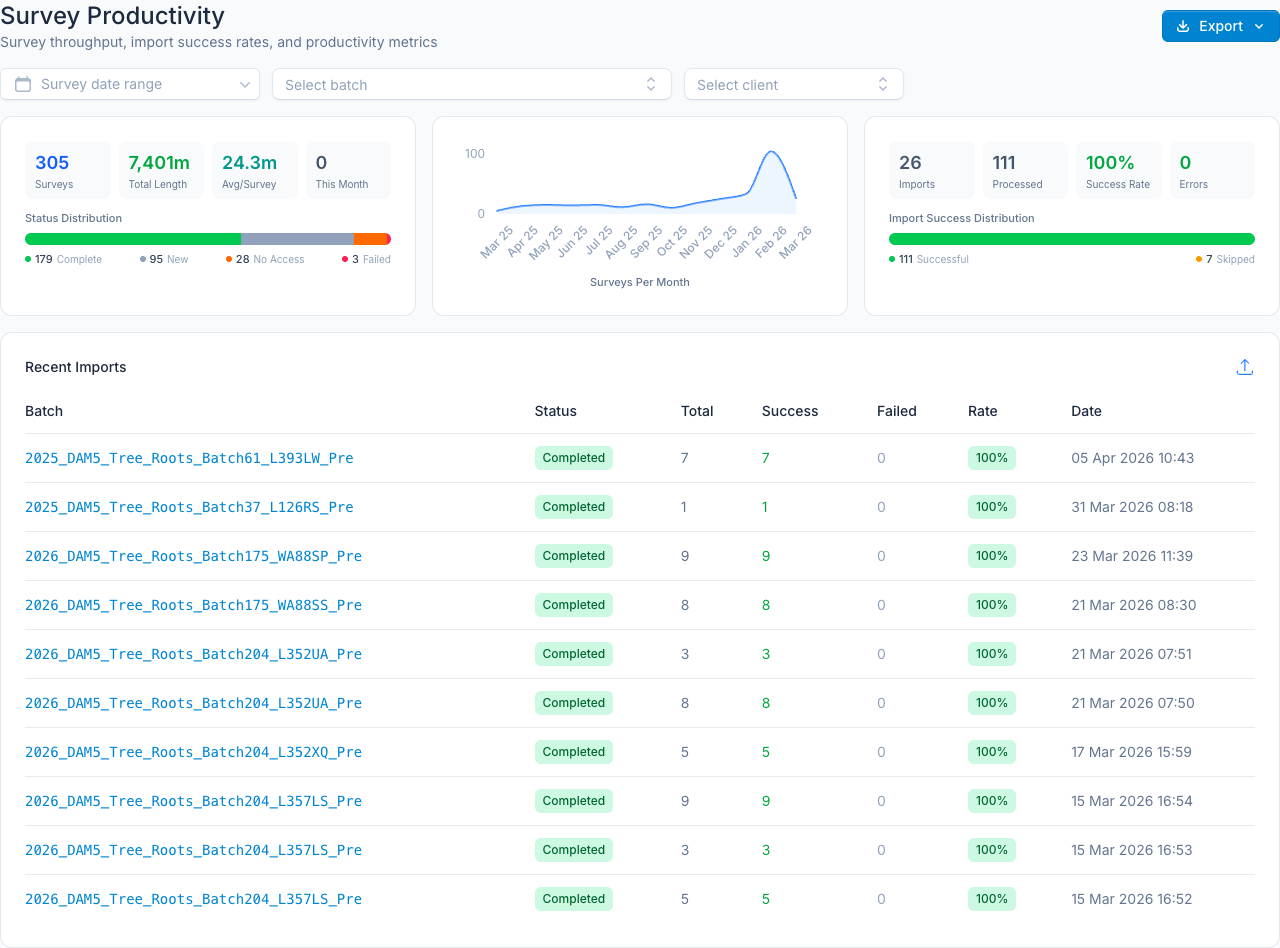
Track your inspection programme's throughput. Total surveys, surveyed length, monthly trends, and import success rates - so you know if your contractors are delivering on target.
 Live view
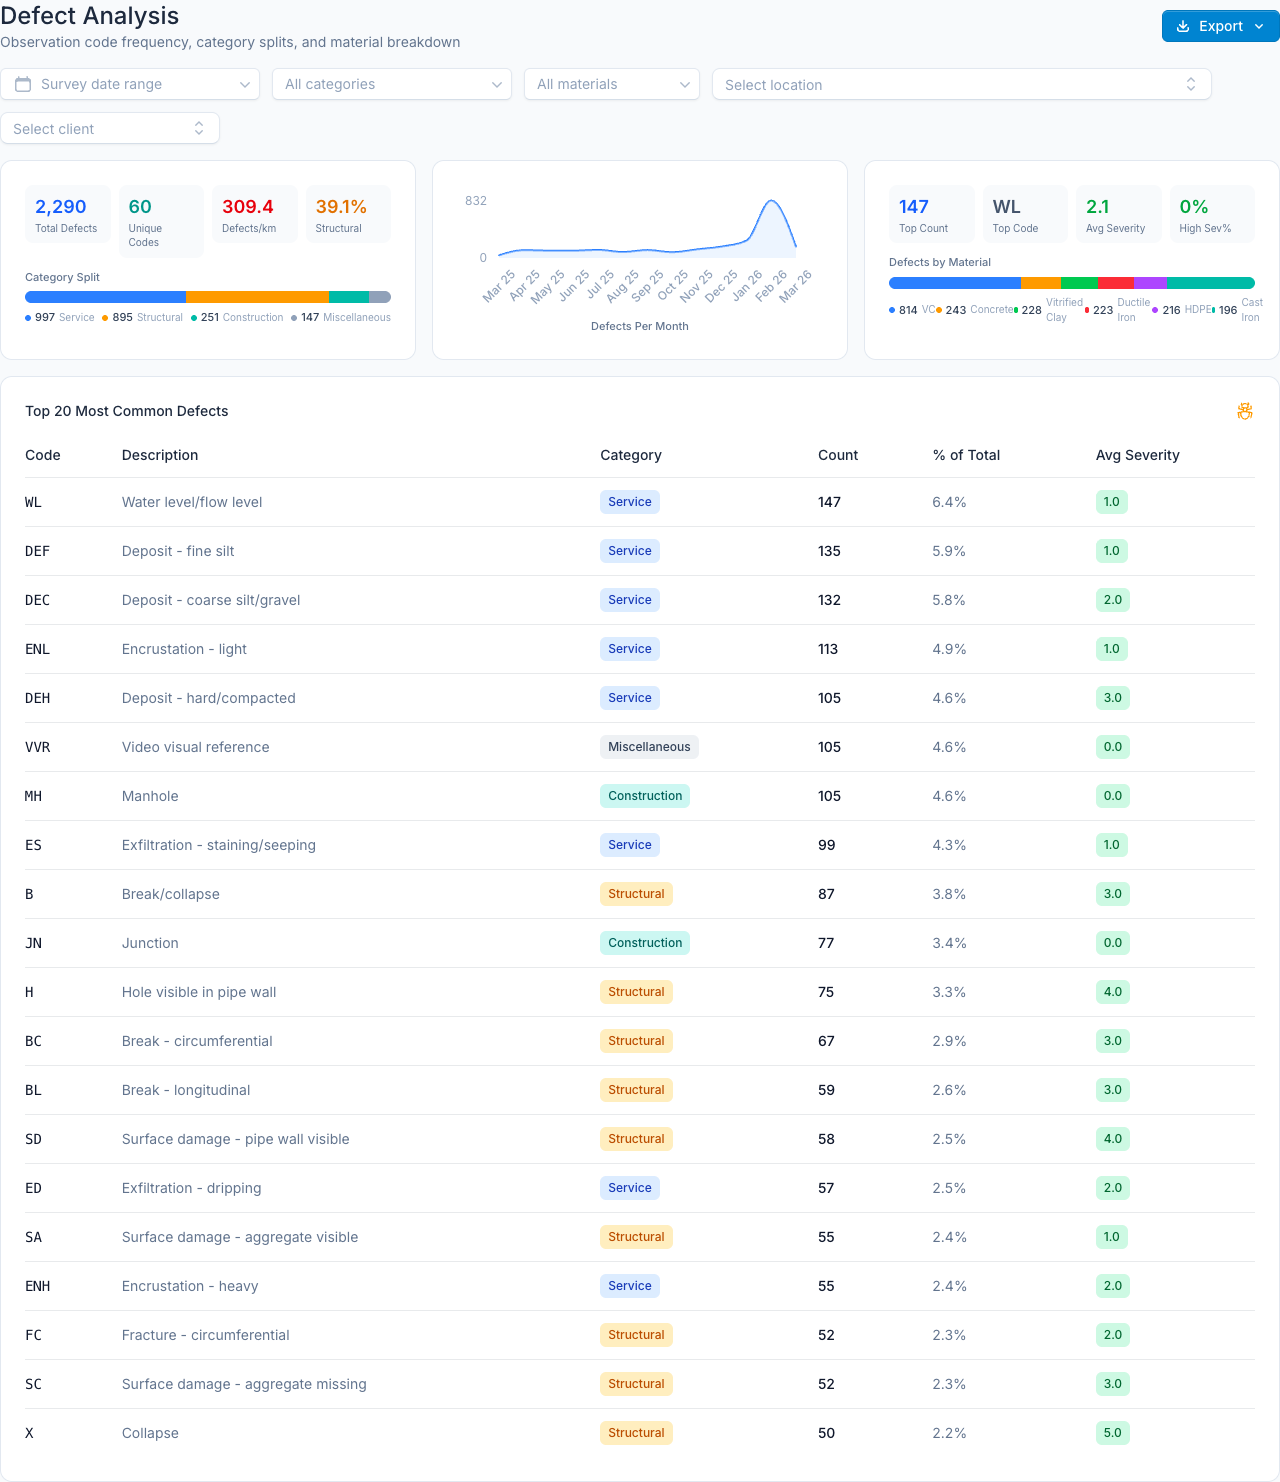
Understand the defect patterns across your network. Which defect codes appear most? How do defects vary by material? What's the severity trend? Your most analytically valuable report.
Live view
Operational performance at a glance. Job status distribution, meterage targets vs. actuals, batch progress, and contractor workload - everything you need for programme management.
 Live view
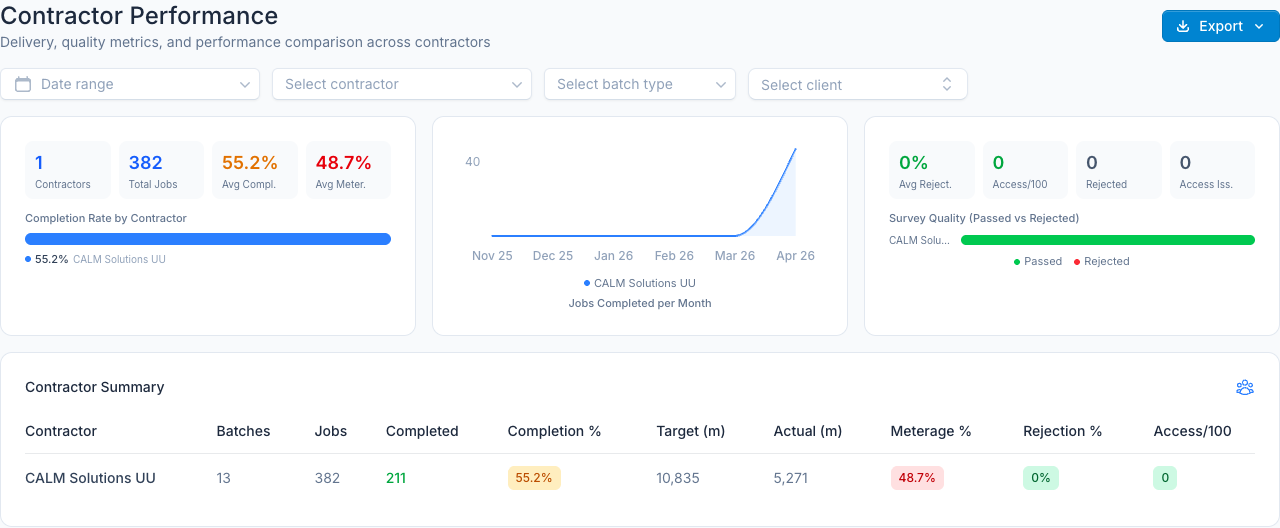
Hold contractors accountable with data. Compare completion rates, meterage delivery, rejection rates, and access issues across all contractors - with monthly trend breakdowns.
 Live view
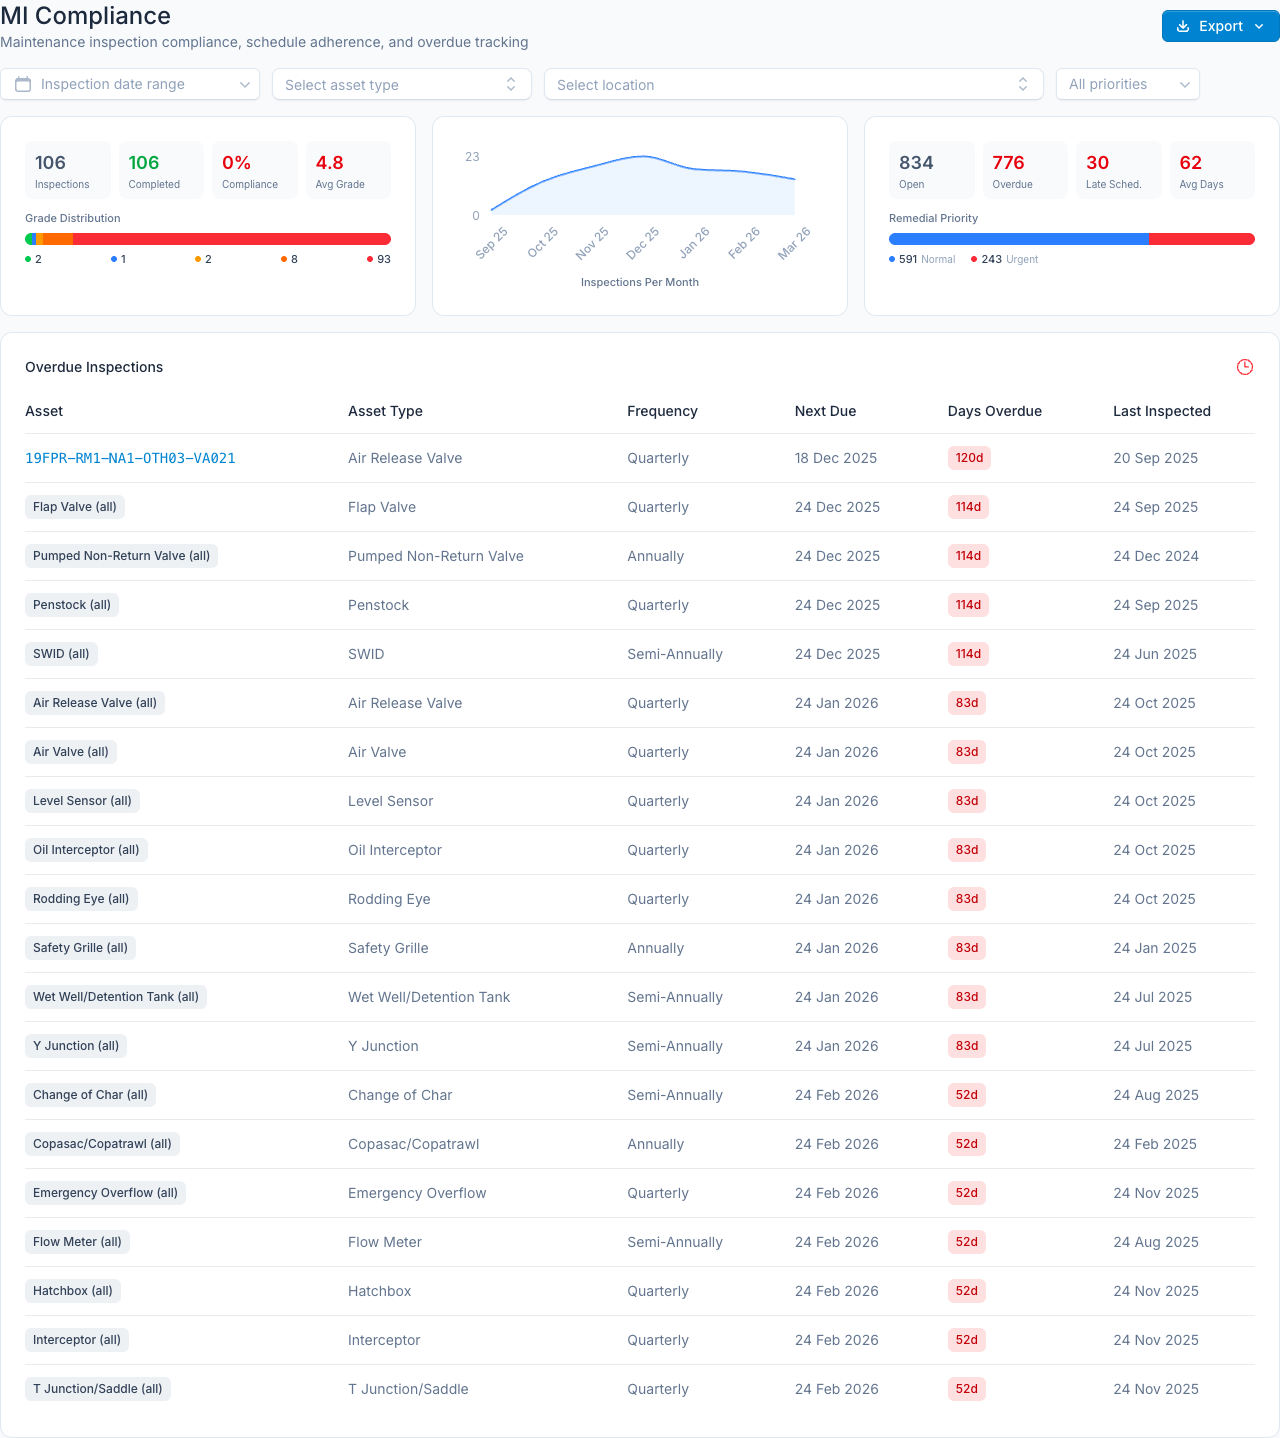
Stay on top of your inspection schedule compliance. Track completed inspections, overdue schedules, open remedials, and average condition grades across your non-pipe assets.
We will map the platform to your AMP8 deliverables and day-to-day workflows.
Enterprise foundations
Access, accountability and data isolation are designed into every layer of the platform.
Granular permissions per feature - control who can view, create, edit, or delete across every module. Role hierarchy prevents privilege escalation.
Every user action is logged with before/after values, timestamps, and attribution. Investigate any change in seconds.
Enforced complexity requirements (uppercase, lowercase, numbers, special characters) across all account operations.
Delegated user administration within role hierarchy. Managers can only manage users below their level.
Full snapshots captured before deletion, with validation checks on restoration. Protect against accidental data loss.
Throttling on all admin operations prevents brute force attacks and resource exhaustion.
Professional, branded reports for surveys, inspections, and analytics. Share with stakeholders who don't have system access.
Documented procedures for detecting, containing, and recovering from security incidents.
Multi-tenant architecture
Each utility receives an independently configured workspace with dedicated access and isolated operational data.
Each organisation accesses the platform through its own URL. No shared screens, no confusion - your team sees only your data.
Data isolation is enforced at the database level, not just the application. It is not possible for one organisation's data to appear in another's view.
Each organisation configures its own asset types, location hierarchy, risk models, decision trees, inspection checklists, and risk bands - completely independent.
New organisations are provisioned in minutes with all default configurations, asset types, and permissions ready to go. Import data and start working immediately.
Choose which modules each organisation can access. Offer different service tiers or hide features that aren't relevant to a specific client.
Track commissioning clients and contractors. Filter all reports and operational data by client for accurate billing and performance monitoring.
Industry Alignment
SewerOne isn't a generic asset management tool adapted for water. It's purpose-built for the UK water and sewerage industry, with the standards and classifications your teams already work with.
MSCC5 defect classification - The industry standard for sewer condition classification, built into every survey import and defect analysis
WRc reference codes - Standard asset type codes from the Water Research Centre, shared across all organisations
NRSWA-aligned permits - Street works permit capture with grid references, traffic management, and reinstatement classification
Sewer use classification - Foul, surface water, combined, and trade effluent - the standard categories used across the industry
Ownership categories - Public, private, adopted, Section 104, Section 106 - supporting adoption and regulatory reporting
OS National Grid & WGS84 - Dual coordinate systems for compatibility with mapping platforms and spatial tools
Start the conversation
Tell us what you manage today and where the evidence chain breaks down. We will tailor the walkthrough around your priorities.